What affects an apartment's price
Location, condition, floor, orientation, housing company renovations, maintenance charge and plot. Which factors affect an apartment's price and how much each is worth in euros. All the factors in order of size, fitted to realised sale prices in Finland.
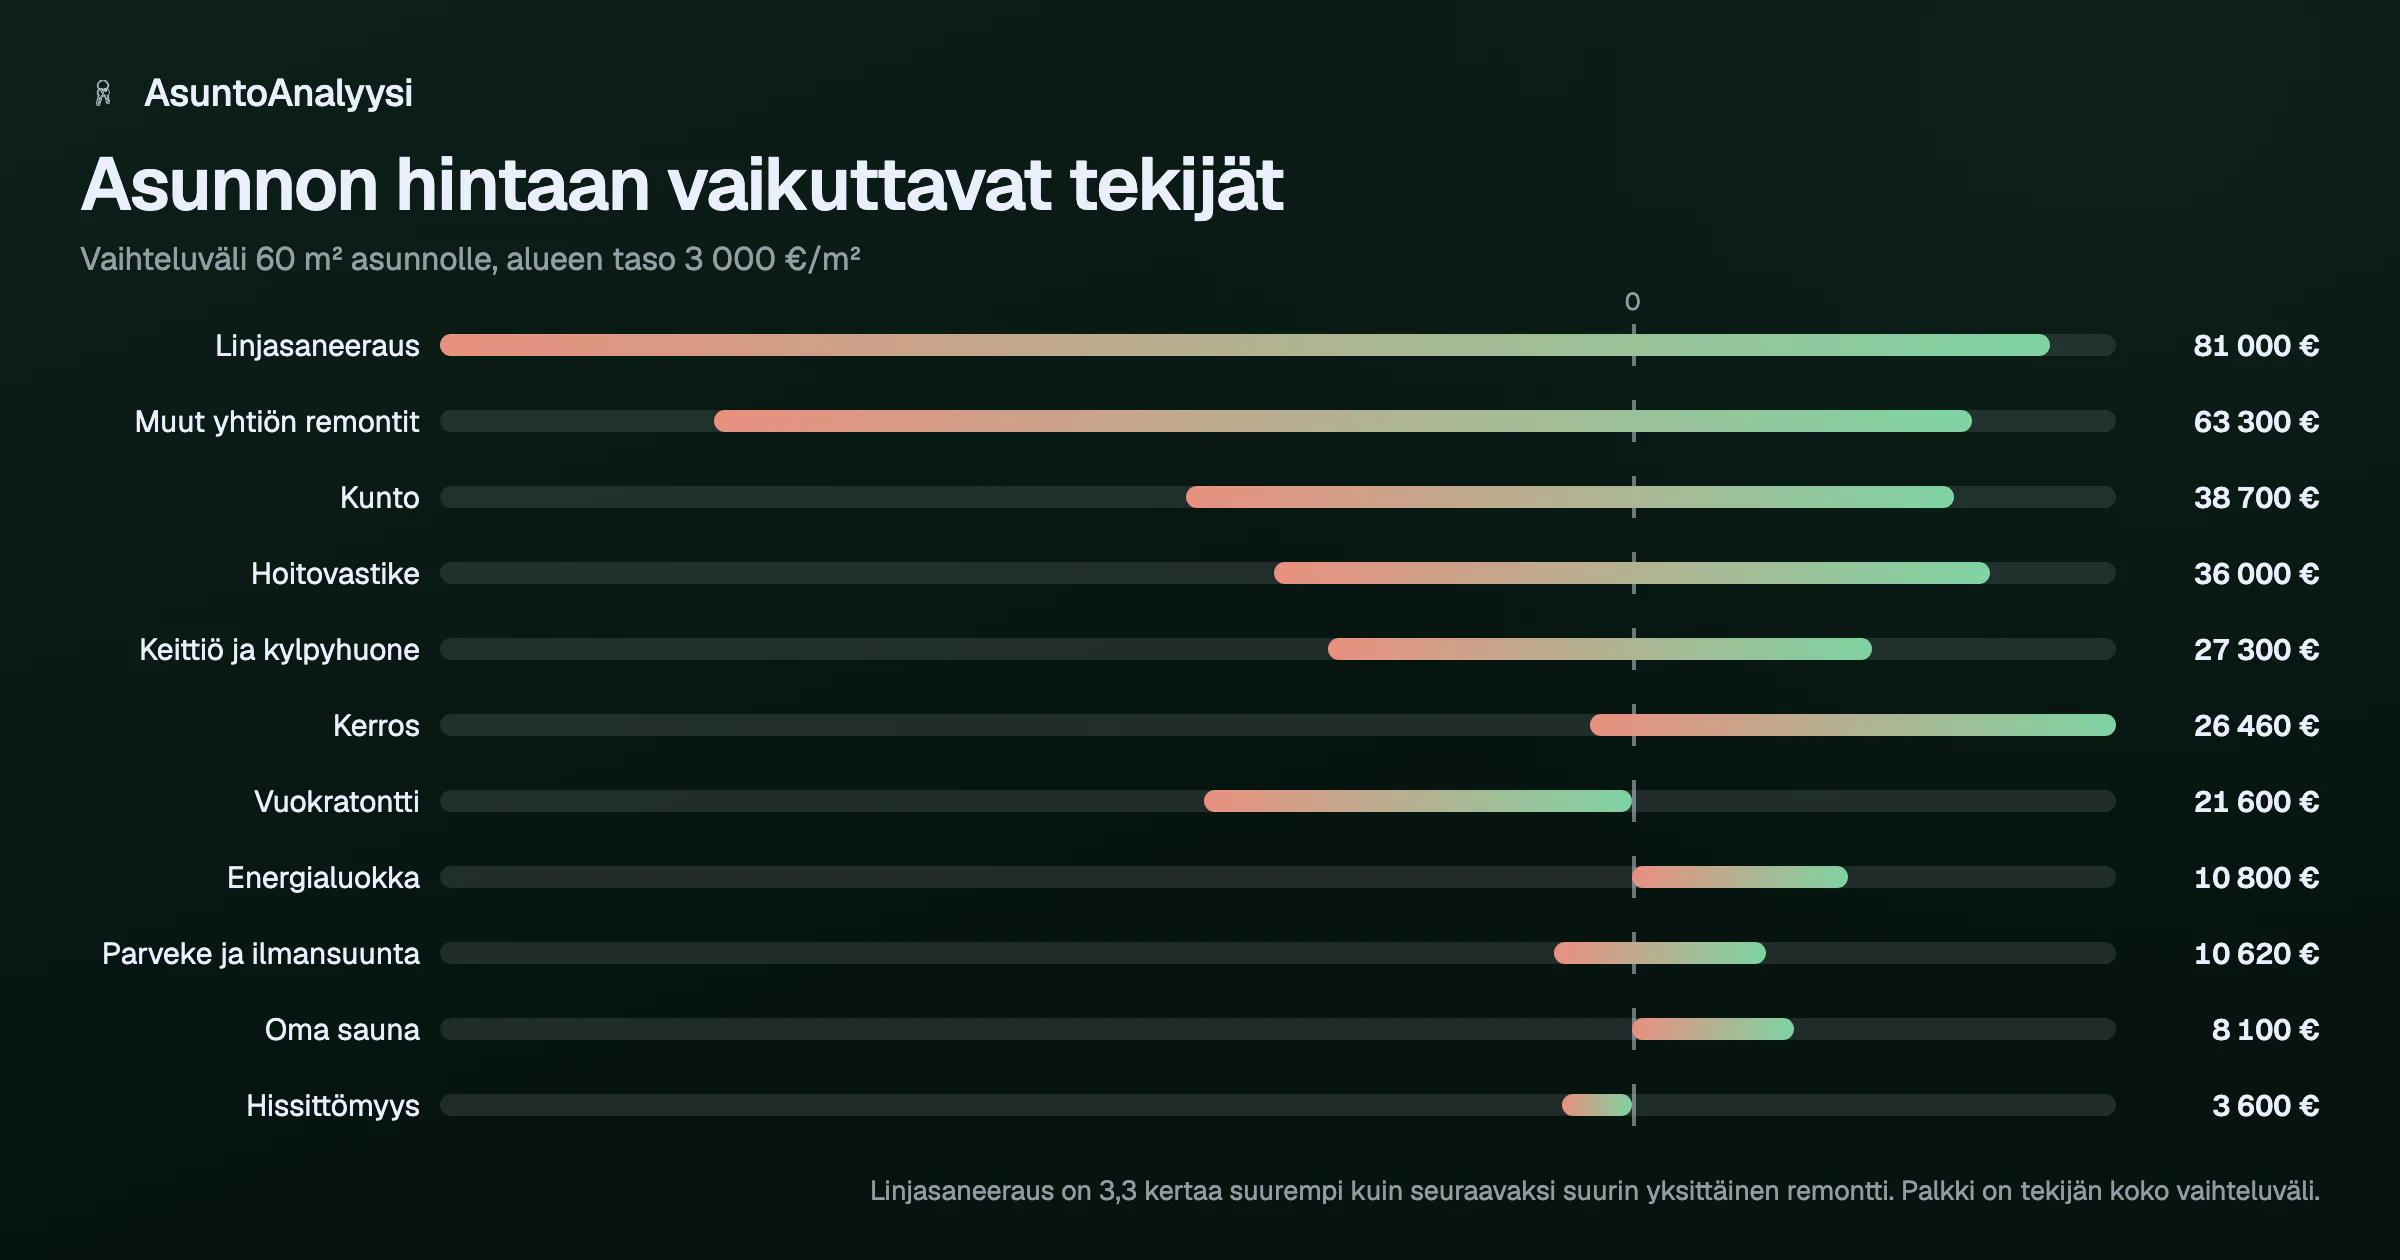
In practice an apartment's price has two parts: the price level of the area and the property's own deviations from it. Location sets the order of magnitude, and on top of it come about ten factors, each of which moves the price by anything from a few per cent to several tens of thousands of euros. This article goes through all of them in order of size and in euros, not just as percentages.
The figures are the same ones AsuntoAnalyysi's estimate is calculated with, and they have two different sources. The percentage coefficients (condition, floor, orientation, sauna, energy class) are fitted to Statistics Finland's realised sale prices: the effect of each factor has been measured within the same area, the same apartment type and the same period, not guessed. The euro amounts for renovations, on the other hand, are typical contract prices as the shareholder's portion. They tell you what a renovation costs, not how much the market penalises it.
- Location: the starting point for everything
- What matters most?
- Housing company renovations
- Condition of the apartment
- Kitchen and bathroom
- Size and number of rooms
- Floor and lift
- Balcony, windows and orientation
- Private sauna
- Energy class
- Maintenance charge (hoitovastike)
- Owned or leased plot
- Build year
- The same factor weighs differently in different areas
- Structural and cyclical factors
- What a price estimate cannot see
Location: the starting point for everything
Location is in a different position from the other factors. It is the level that everything else is compared with. The estimate starts from the realised average price per m² in the postcode area, from sales of the same apartment type over the last 12 months. All the factors below are deviations from that figure, which is why they are mostly expressed as percentages.
The practical consequence: an apartment of the same size and condition can cost several times as much in Finland purely because of its postcode, and that difference is larger than the effect of all the other factors combined. It is not something a buyer can fix with a renovation. The differences between areas and how they have developed are shown in the area directory and in the article 20 years of apartment prices (in Finnish).
What matters most?
Below is every pricing factor in the model, ordered by how much it can swing the price at most. The right-hand column is the difference between the extremes, i.e. the full width of the range in euros, for a 60 m² apartment in an area where the price per m² is €3,000/m² (an illustrative example, not an average calculated from the data):
| Factor | Range | Difference, 60 m² |
|---|---|---|
| Pipe renovation (linjasaneeraus) | −1,000 … +€350/m² | €81,000 |
| Other housing company renovations combined | −770 … +€285/m² | €63,300 |
| Condition | −12.5% … +9% | €38,700 |
| Maintenance charge (hoitovastike) | −10% … +10% | €36,000 |
| Construction era | −9.4% … +9.8% | €34,600 |
| Kitchen and bathroom | −255 … +€200/m² | €27,300 |
| Floor | −1.2% … +13.5% | €26,500 |
| Leased plot | −12% … 0% | €21,600 |
| Energy class | 0% … +6% | €10,800 |
| Balcony and orientation | −2.2% … +3.7% | €10,600 |
| Private sauna | 0% … +4.5% | €8,100 |
| No lift | −2% … 0% | €3,600 |
The order surprises most people: the housing company's renovation situation dominates the list and leaves below it the features people look at during a viewing. The sauna, balcony and lift are at the bottom of the list. They all have an effect, but none of them is in the same league as an upcoming pipe renovation.
One caveat about the order: it holds at this price level. The contract price of a renovation is roughly the same everywhere in Finland, whereas condition, floor and sauna are shares of the area's price per m². In an expensive area the percentage factors therefore move up the list: condition overtakes the pipe renovation in an area where the price per m² is above about €6,300/m². In cheap areas, however, the order does not flip the other way, because there the price effect of a renovation is also a share of the local level. We come back to this in the section the same factor weighs differently in different areas.
Housing company renovations
With a housing company apartment, the buyer buys a share of the housing company, not just the space inside their own walls. That is why the housing company's backlog of repairs passes into the sale price. An upcoming renovation is a future bill, paid through the charges or a company loan. The model prices the housing company's major renovations as the shareholder's typical portion per square metre of the apartment:
| Renovation | Ahead | Done | Service life |
|---|---|---|---|
| Pipe renovation (linjasaneeraus) | −1,000 | +350 | 45 yrs |
| Facade renovation | −300 | +110 | 40 yrs |
| Window renovation | −100 | +40 | 45 yrs |
| Roof | −140 | +55 | 35 yrs |
| Electrical renovation | −110 | +35 | 45 yrs |
| Heating | −120 | +45 | 45 yrs |
Two things are worth reading from the table. First, the pipe renovation is in a class of its own: it is 3.3 times the next most expensive one (facade renovation). Second, the value added by a completed renovation is clearly smaller than the deduction for an upcoming one. That is how the market behaves, not a bias in the model: part of a completed renovation is paid back, but the buyer does not reimburse the whole contract. In return they get a home where living is not interrupted for months.
A completed renovation does not last forever either. Each has a technical service life, and its value falls steadily over it: a pipe renovation done 45 years ago no longer adds value but marks the start of the next round. A closer look at what "pipe renovation done" really means, and why it can mean three different things, is in the article how much a pipe renovation lowers an apartment's price.
Condition of the apartment
After renovations, condition is the largest single factor, and it is the first one the buyer can influence themselves. What matters is the reference point: the area's average price includes apartments in every condition, and the typical sale is of an apartment in good condition. That is why satisfactory condition is below average, not zero. This is the most common mistake when comparing apartments.
In our example apartment the difference between fully renovated and in need of renovation is €38,700. Condition is also one of the factors whose effect varies with the market: in a buyer's market the need for renovation is penalised more harshly than in a seller's market (see cyclical factors).
Kitchen and bathroom
Renovations inside the apartment are smaller than the housing company's, but they are the most visible: they are the first thing a buyer sees at a viewing. The bathroom weighs more than the kitchen, because it carries a risk of water damage, not just a question of looks.
| Item | Original | Renewed | Service life |
|---|---|---|---|
| Kitchen | −€110/m² | +€90/m² | 20 yrs |
| Bathroom / wet rooms | −€145/m² | +€110/m² | 25 yrs |
Service lives are shorter than for housing company renovations, so their value also ages faster: a kitchen renewed 10 years ago is already halfway through its service life. Note also that an original bathroom in practice means original waterproofing, and that is part of the pipe renovation, not a separate cosmetic renovation.
Size and number of rooms
The price per m² falls as the apartment gets bigger: a square metre of a studio costs more than a square metre of a three-room apartment, because the kitchen, bathroom and hall cost roughly the same regardless of the apartment's size. The difference is large. In the data for blocks of flats, the price per m² of a studio is typically about a tenth higher than that of an apartment with three or more rooms, and at the extremes one and a half times as high.
The model has no separate coefficient for this, and none is needed: the reference figure is taken from sales of the same apartment type (studio, two rooms, three rooms or more), so size is already controlled for. The exception is terraced houses, for which Statistics Finland publishes only one figure for all sizes at postcode level, so for a terraced house the area's reference figure is coarser than for a block of flats. This cannot be fixed by fetching more data, because the breakdown by number of rooms does not exist at postcode level, so instead 6 percentage points are added to the estimate range for terraced and semi-detached houses: the estimate states its uncertainty rather than claiming a precision the data does not have.
Floor and lift
In a block of flats the value rises by about +1.2% per floor (view, light, quiet) up to floor 8, and above it by a damped +0.4% per floor, up to a maximum of +12%. The reason for the damping is that the view and light are gained once you are above the roofline, and are not bought again on every floor. Street level is −1.2% below average. The top floor also gets its own premium, larger in a tall building than in a low one, up to +13.5%.
Having no lift is a threshold, not a drawback that grows floor by floor: from floor 4 upwards the effect is −2%, and on lower floors the stairs are tolerable and there is no effect at all. Nor does the drawback grow higher up, because on the top floors the view makes up for the climb. In buildings with fewer than 4 floors, having no lift is the norm and no deduction is made at all.
Balcony, windows and orientation
Having a balcony is not a price factor in itself; the difference comes from the direction it faces. The same goes for the apartment's windows. Below is the effect in euros in a 60 m² example apartment:
| Direction | Balcony | Windows |
|---|---|---|
| South | +€4,500 | +€2,200 |
| South-west | +€4,500 | +€2,200 |
| South-east | +€3,600 | +€1,400 |
| West | +€2,200 | €0 |
| East | +€2,200 | €0 |
| North-east | +€500 | €-1,100 |
| North-west | +€500 | €-1,100 |
| North | €0 | €-2,200 |
The direction of the windows works both ways (an apartment facing north is −1.2% below average), whereas the direction of the balcony only works upwards. A deduction of −1% for having no balcony is only made in buildings built in 1975 or later: in older stock having no balcony is so common that it is already part of the area's price level.
Private sauna
A sauna in the apartment raises the estimate by +4.5%, or €8,100 in our example apartment. It is a price factor in its own right, even when size, condition and the age of the building have already been accounted for separately.
An important clarification: this is about the apartment's own sauna, not the housing company's shared sauna. Listings mix these up all the time, and a shared sauna often exists precisely in buildings whose apartments have no sauna of their own.
Energy class
The energy class is priced only from the top: buyers pay +6% for class A and +3% for class C, but no separate deduction is made for classes D–G. The reason is to avoid counting the same thing twice: the heating costs caused by a poor energy class already show in the maintenance charge, which is a separate factor in the model.
A good class, on the other hand, is a sign of a technically up-to-date building. It goes together with newer building stock, mechanical heat recovery and the absence of a repair backlog. Buyers pay more for it than the difference in heating bills alone would explain.
Maintenance charge (hoitovastike)
The maintenance charge (hoitovastike) is an ongoing cost, and an ongoing cost is capital. The price difference between two otherwise identical apartments matches the capitalised value of the difference in charges: in the model, a deviation of €1/m² a month corresponds to about €75/m² in the apartment's price, and the effect is capped at ±10% of the local level.
The reference point is the area's typical charge level, not zero, so a normal charge does not move the estimate either way. The financing charge (rahoitusvastike) is not included at all: the company loan is already part of the debt-free price, and the same debt is not counted twice.
Owned or leased plot
A housing company on a leased plot does not own the land the building stands on. The effect works by the same logic as the maintenance charge: plot rent is an ongoing cost that is capitalised back into the price. If the listing does not state the rent, the model uses a fixed deduction of −7%.
For the buyer, though, the most important thing to check is something other than the current rent: the end year of the lease. On renewal the rent is set from the plot's current value and can multiply in one go. The topic is covered in full in its own article, how a leased plot affects an apartment's price.
Build year
The year of construction affects the price more than any single coefficient suggests, because it works through everything else: it sets the timing of renovations and says something about the energy class, the layout and the construction method. The model uses it mainly in the renovation logic: when there is no information on renovations, the age of the building indicates what is probably ahead.
The value of a new building therefore comes mainly from all its renovations being far in the future. Conversely, in a building from the 1970s many of them are falling due right now. The inference only works during the first service life, though: in a building more than 60 years old the pipe renovation has almost certainly been done at some point, and age no longer distinguishes between properties. In that case the model does not claim to know, and advises you to check the property manager's certificate (isännöitsijäntodistus).
The same factor weighs differently in different areas
The ranking above has one condition worth understanding: some factors are shares of the area's price per m² (condition, floor, sauna, energy class) and some start from a fixed contract price (all renovations). A renovation costs roughly the same in Helsinki and Kajaani, but what it costs and how much the market penalises it are two different things, and the gap between them grows the cheaper the area.
The reason lies in what the estimate is compared with. The reference point is the area's average price, and it already includes the area's typical repair backlog: in an area where the level is €1,500/m², buildings with a pipe renovation ahead are sold all the time, and that already shows in the average price. If the full contract price were deducted from the average, the same thing would be counted twice, and in the cheapest areas a single pipe renovation would in practice wipe out the whole value of the apartment. That is why the model scales the price effect of a renovation to the local level: €3,000/m² is the level at which the full contract price is the right market discount, and below it the effect is a fixed share of the apartment's value. The contract price of the pipe renovation is the same €1,000/m² on every row; what varies in the table is how much of it goes into the estimate.
| Area level | Effect | Share of value | Poor condition |
|---|---|---|---|
| €1,500/m² | −500 | −33% | −188 |
| €2,500/m² | −833 | −33% | −313 |
| €4,000/m² | −1,000 | −25% | −500 |
| €6,000/m² | −1,000 | −17% | −750 |
The table reads two ways. In an expensive area the contract price goes into the estimate in full, but it is a small share of the apartment's value: 17% in an area at €6,000/m². In a cheap area the share is larger, 33%, but it no longer grows without limit, because the area's own price level already tells part of the story. Read either way, the conclusion is the same: the relative weight of a repair backlog grows the cheaper the area, and that is why in areas where prices are falling it matters more to find out the renovation situation than in growing ones: there an upcoming renovation cannot be financed by selling, because the sale price does not cover it.
Structural and cyclical factors
Not all factors are equally stable. Some have roughly the same effect whether it is a buyer's or a seller's market. Others move with the cycle:
- Structural (stable across the cycle): size, floor, lift, sauna, balcony and orientation, energy class, maintenance charge.
- Cyclical (deepen in a buyer's market): condition and leased plot. When buyers are few, the need for renovation and an ongoing extra cost are penalised more harshly; when demand is strong, they are overlooked.
For cyclical factors the model uses a middle value, not an extreme. In practice, for the buyer: the premium paid for an apartment in good condition is largest in a quiet market, and the discount on a property needing renovation narrows if the market turns before you sell.
What a price estimate cannot see
An estimate based on statistics is good at what can be measured and blind to everything else. These are left out of it entirely, and they are not small things:
- View, noise and micro-location. A sea view, a railway line under the window or a quiet courtyard do not show in postcode-level statistics.
- The housing company's finances. Its loans, the repair backlog in money, the right to buy the plot and how well it is run are in the property manager's certificate (isännöitsijäntodistus), not in the listing.
- How well the layout works. Two 60 m² three-room apartments can be completely different homes to live in.
- Hidden damage. Moisture damage or a mould problem does not show as a price discount; it is a question of its own that only a condition inspection can answer.
- The sale situation. An estate in a hurry, a move to another town or a long time on the market affect the final price more than many of the coefficients on this list.
That is why a price estimate is a starting point for negotiation and a way to spot outliers, not the final price. It answers the question "is this asking price in line with what has been paid for similar apartments in this area", not "should I buy this particular apartment".
In brief
- Location sets the level; everything else is a deviation from it. You cannot renovate an area.
- The housing company's renovation situation is the largest property-specific factor, and it is exactly what you cannot see at a viewing.
- After renovations, condition weighs the most, and satisfactory condition is below average, not zero.
- Ongoing costs are capital: the maintenance charge and plot rent pass into the price in capitalised form.
- The euro cost of renovations is roughly the same everywhere, so a repair backlog weighs relatively most in cheap areas.
- The view, the housing company's finances and the layout are not in any statistics, so you have to look at them yourself.
You can see the figures for your own property by pasting an Oikotie or Etuovi link into the search box on the front page: the analysis puts each of the factors above on its own line in euros and shows where the gap to the asking price comes from. The reasoning and sources for the coefficients are on the Data sources & method page (in Finnish).