Kokkola apartment prices
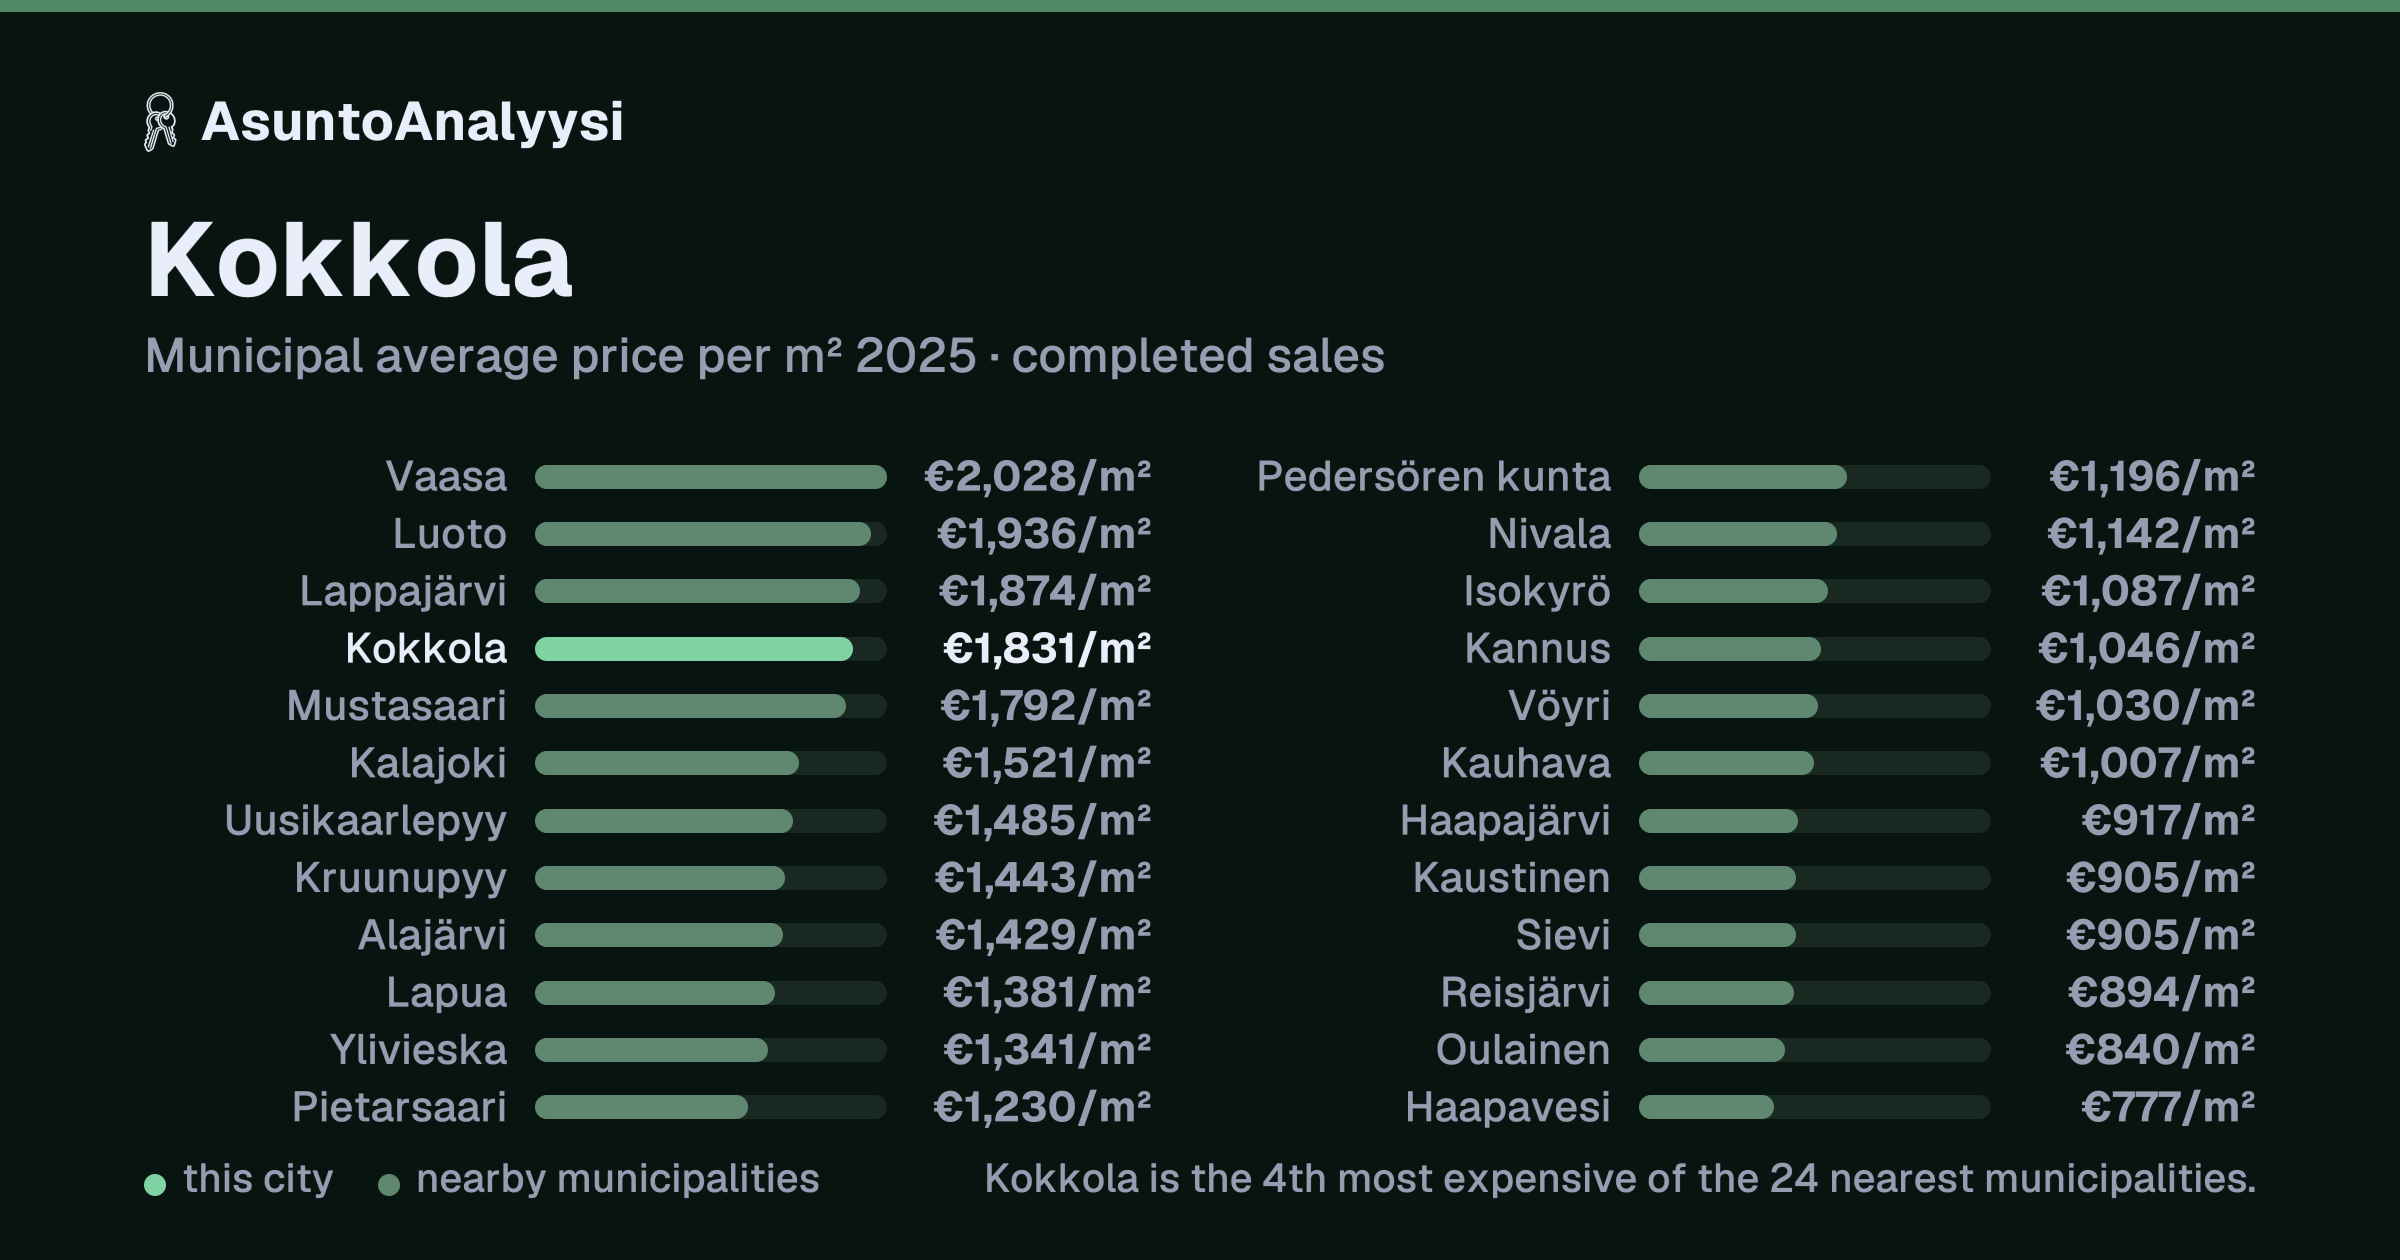
Prices per m² by building type
| Building type | €/m² | Sales | 1 v | 5 v |
|---|---|---|---|---|
| All building types | 1,831 | 422 | +5.6% | +2.2% |
| Apartment buildings | 1,834 | 261 | +8.5% | +5.1% |
| Terraced houses | 1,827 | 161 | +1.4% | −2.0% |
Price trend 2006–2025
Prices per m² by postcode area
Kokkola has 5 postcode areas with enough completed sales to calculate their own average price.
| Area | €/m² | Sales | Change |
|---|---|---|---|
| Halkokari 67300 |
2,529 | 30 | +4.9% |
| Rytimäki 67400 |
1,928 | 13 | – |
| Kokkola Keskus 67100 |
1,866 | 183 | +1.7% |
| Kiviniitty-Tullimäki 67200 |
1,642 | 29 | −4.9% |
| Kirkonmäki-Isokylä 67700 |
1,522 | 8 | −11.1% |
Detached house prices by postcode area
Kokkola: realised sale prices of detached house properties in the 13 postcode areas with enough sales to calculate their own average. The figures are total property prices, plot and building together, and are not adjusted for house size.
| Area | Average price | Sales |
|---|---|---|
| Kirkonmäki-Isokylä 67700 |
226,509 | 57 |
| Halkokari 67300 |
206,450 | 41 |
| Koivuhaka 67800 |
202,557 | 14 |
| Rytimäki 67400 |
195,696 | 60 |
| Ruotsalo 68320 |
195,167 | 12 |
| Linnusperä-Kaustari 67600 |
186,836 | 44 |
| Kokkola Keskus 67100 |
181,547 | 64 |
| Kiviniitty-Tullimäki 67200 |
161,320 | 20 |
| Ykspihjala 67900 |
150,444 | 9 |
| Sokoja 67500 |
144,811 | 20 |
| Kälviä Keskus 68300 |
143,212 | 46 |
| Vitsari 67410 |
97,400 | 10 |
| Öja 68550 |
85,250 | 12 |
Rent level
Average rents for non-subsidised rental homes across the whole city (2026Q3). The example rent shows what a typically sized apartment would cost per month at this rent level.
| Type | Average rent | New | Example |
|---|---|---|---|
| Studios | 16.93 | – | €540/mo 32 m² |
| 2 rooms | 12.14 | 13.49 | €670/mo 55 m² |
| 3+ rooms | 9.78 | – | €780/mo 80 m² |
Population and residents
| Population residents | 47,731 | ▲ +3.8% since 2010 |
| Mean age years | 43 | ▼ −1 yr vs. all of Finland |
| University-educated share of residents | 25% | ▼ −4 pp vs. all of Finland |
| Employment rate of the labour force | 91% | ▲ +2 pp vs. all of Finland |
| Rental homes of households | 30% | ▼ −8 pp vs. all of Finland |
| Average home size m² | 89 | ▲ +13% vs. all of Finland |
Population forecast 2024–2045
According to Statistics Finland's forecast, Kokkola is staying roughly unchanged: the population in 2045 will be about 49,053, compared with 48,482 in 2024.
| In 2029 residents | 48,889 | ≈ +0.8% vs. 2024 |
| In 2034 residents | 48,982 | ≈ +1.0% vs. 2024 |
| In 2045 residents | 49,053 | ≈ +1.2% vs. 2024 |
Home price estimate: Kokkola
The figures above are area averages. The value of an individual apartment differs from them depending on its condition, its floor, what has been renovated in the housing company and the maintenance charge. AsuntoAnalyysi calculates an estimate from these using completed sales in your own postcode area.
Two factors weigh differently on the estimate at different price levels, and they work in opposite directions. A renovation costs the same in a cheap and an expensive area, but in a cheaper area a smaller sum is deducted from the estimate, because the area's average price already includes its typical repair backlog. The maintenance charge, on the other hand, is a fixed amount per m², so its share of the apartment's value grows as the area gets cheaper. At the €1,831/m² level of Kokkola, that means this:
| Factor | In a 70 m² apartment | Share |
|---|---|---|
| Upcoming pipe renovation | −€42,700 | −33.3% |
| Maintenance charge €1/m²/mo above the area level | −€5,300 | −4.1% |
Frequently asked: Kokkola
Kokkola: what is the average apartment price per m²?
In 2025, apartments in Kokkola sold for an average of €1,831/m². The figure is based on 422 completed apartment sales (Statistics Finland, municipal statistics). By building type: apartment buildings €1,834/m², terraced houses €1,827/m².
Kokkola: are apartment prices rising or falling?
The average price per m² rose by 5.6% from 2024 to 2025. The five-year change is +2.2% and the ten-year change −2.7%.
Kokkola: how much is my home worth?
The area's average price per m² is €1,831/m², but the value of an individual apartment differs from it according to its condition, floor, housing company renovations and maintenance charge. AsuntoAnalyysi calculates an estimate from completed sales in your own postcode area and takes these factors into account. For example, an upcoming pipe renovation lowers the estimate at this price level by about €42,700 for a 70 m² apartment.
Kokkola: how much does a rental home cost?
Average rents for non-subsidised rental homes are studios €16.93/m²/mo, 2 rooms €12.14/m²/mo, 3+ rooms €9.78/m²/mo (Statistics Finland, 2026Q3). At this level the rent for a typical 32 m² studio would be about €540 a month.
Kokkola: how many residents does the area have?
The city's postcode areas have 47,731 residents in total (2024). The mean age is 43. The population has grown by 4% since 2010.
Sources and method
- City prices: Statistics Finland, prices of old housing company apartments by municipality (StatFin 13mx). Annual statistics, latest year 2025. The municipal figure includes all completed sales in the city.
- Postcode area prices: Statistics Finland, prices of housing company apartments (StatFin 13mt). Quarterly, sales-weighted average of the last 4 quarters.
- Rents: Statistics Finland, rents of housing company apartments (StatFin 15fa, non-subsidised). Quarter 2026Q3.
- Population and education: Statistics Finland, Paavo: open data by postcode area (12f7). Statistical year 2024.