Littoinen 20660
Kaarina · Realised apartment prices per m², rent level and population profile from Statistics Finland's open data · updated 17 August 2026.
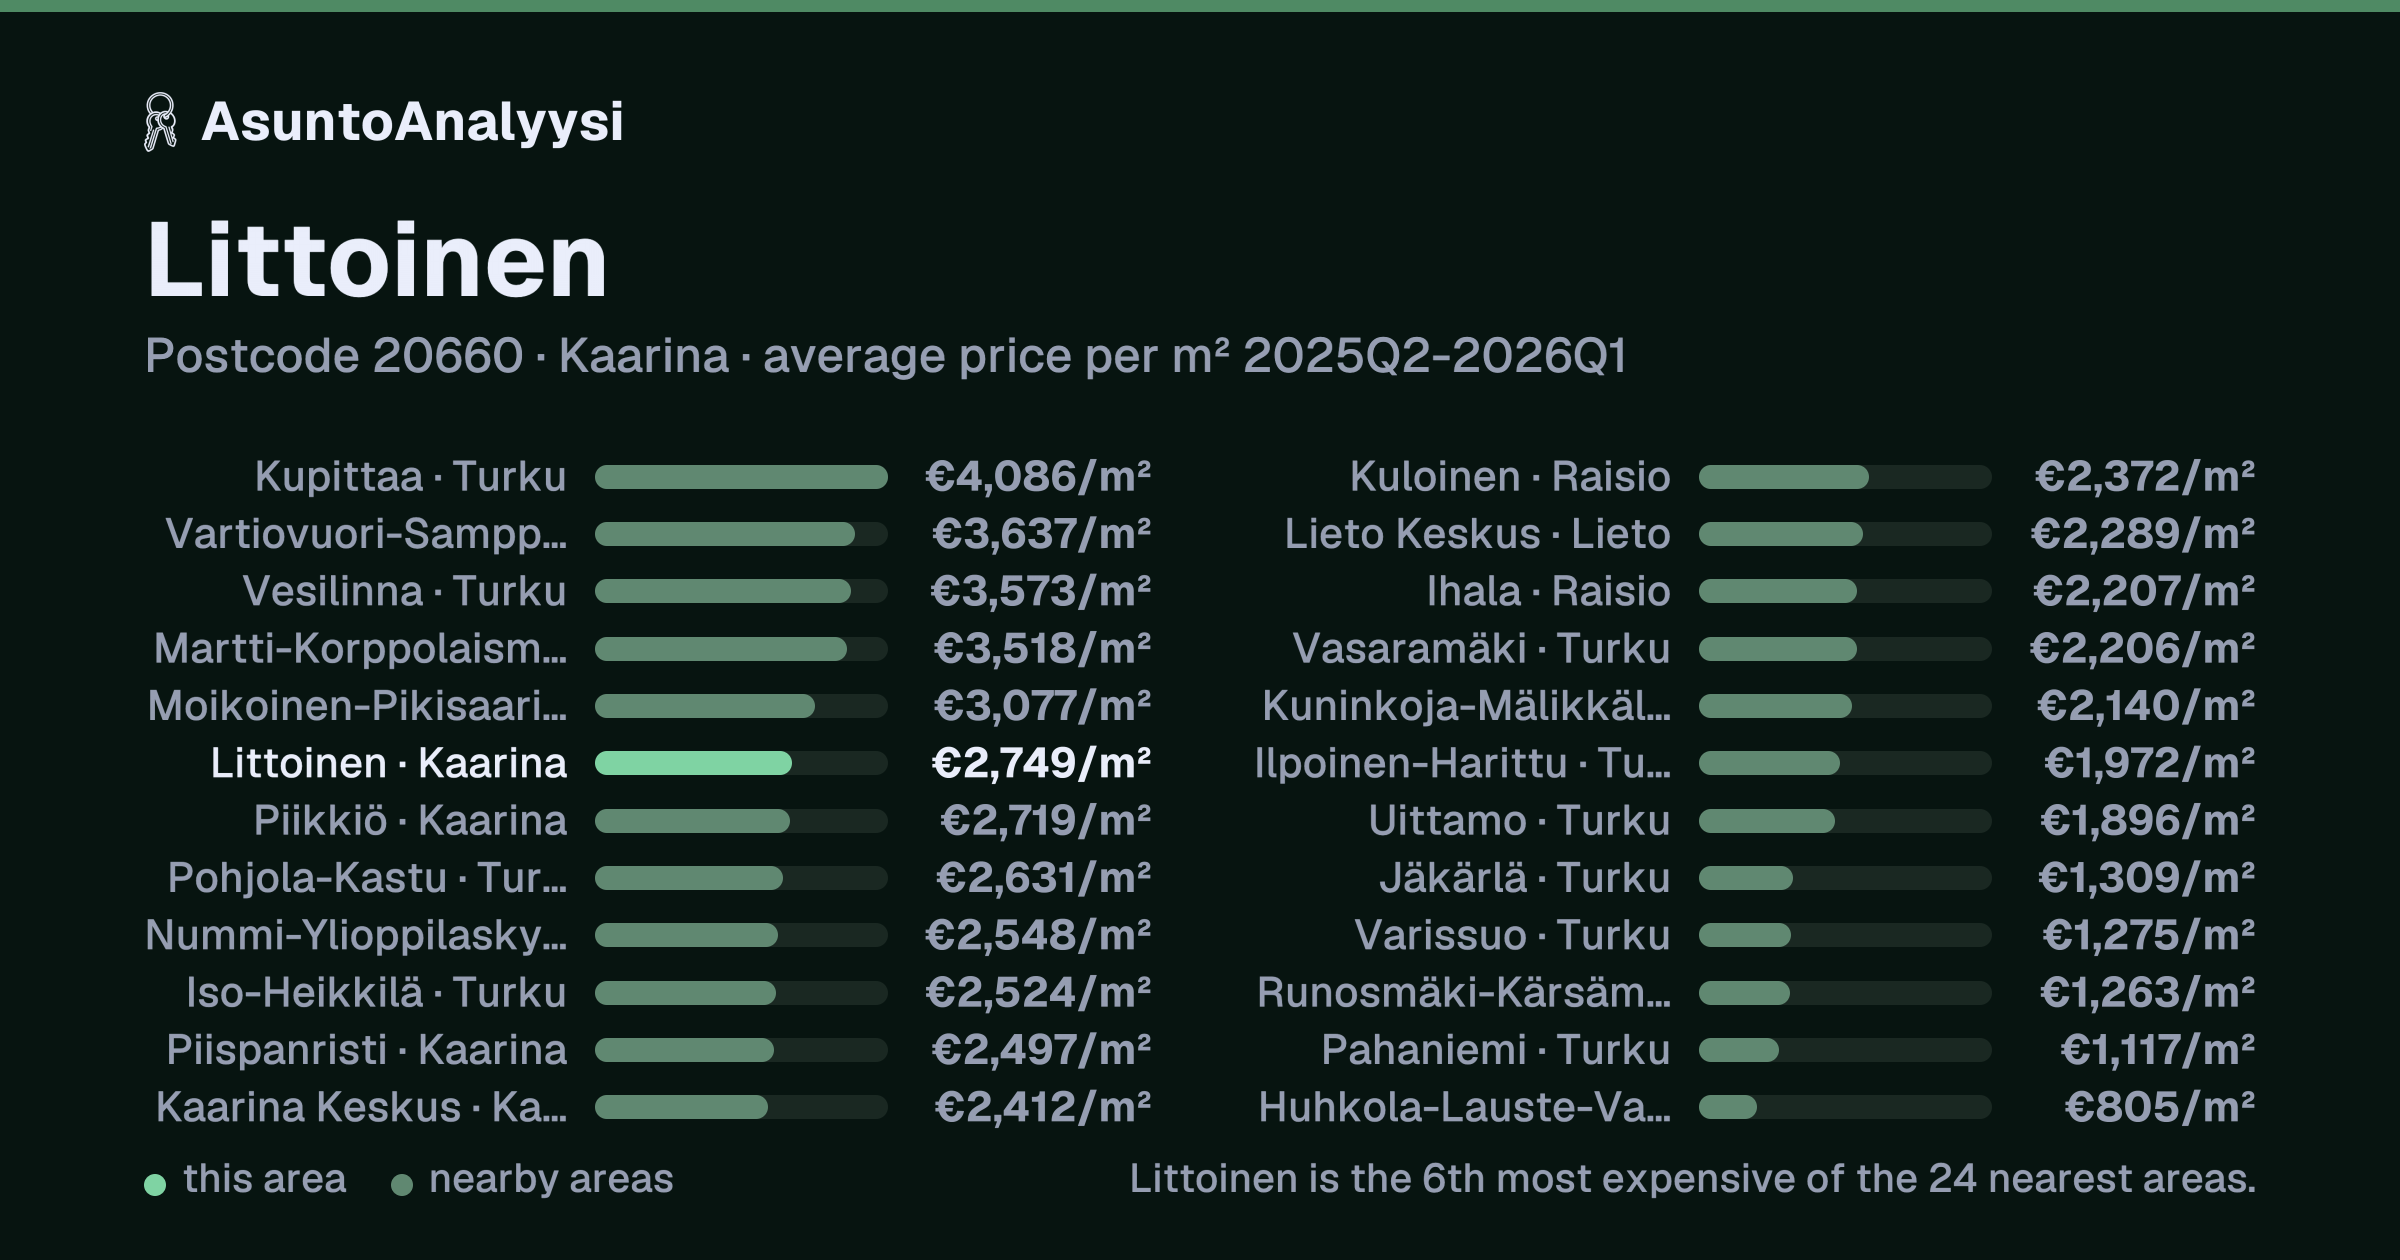
Prices per m² by apartment type
Average prices per m², weighted by number of sales, from completed apartment sales in postcode area 20660 over the last 12 months (Q2/25, Q3/25, Q4/25, Q1/26*). The example price shows what a typically sized apartment would cost at the area's average price per m².
| Type | €/m² | Sales | Change | Example |
|---|---|---|---|---|
| Terraced houses | 2,749 | 36 | +1.6% | €234,000 85 m² |
Price trend Q2/23–Q1/26*
Sales volume trend in the area
How many apartment sales took place in postcode area 20660 per quarter, stacked by apartment type: 112 sales in total over Q2/23–Q1/26*. The number of sales reflects turnover in the area: in an active area price estimates are more reliable and time on market shorter, while fading volumes signal cautious buyers.
Detached house sale prices 2017–2026
Postcode area 20660 had 111 detached house sales in 2024–2026, at an average sale price of €276,644. Prices have changed by +1.9% a year on average. The figure is the total property price, plot and building together, and is not adjusted for house size. How the detached house figures are calculated (in Finnish) →
| Year | Average price | Sales |
|---|---|---|
| 2026* | 270,941 | 29 |
| 2025 | 261,841 | 42 |
| 2024 | 296,323 | 40 |
| 2023 | 219,900 | 45 |
| 2022 | 292,315 | 53 |
| 2021 | 286,545 | 64 |
| 2020 | 252,943 | 58 |
| 2019 | 244,267 | 58 |
| 2018 | 242,594 | 59 |
| 2017 | 231,651 | 53 |
Rent level and rental yield
Average rents for non-subsidised rental homes are at the level of Rest of Finland (2026Q3): Statistics Finland does not publish rents by postcode. The rental yield uses this area's realised price per m² and the city's rent level, so it is indicative.
| Type | Average rent | Example | Gross | Net |
|---|---|---|---|---|
| Terraced houses | 11.80 | €1,000/mo 85 m² |
5.2% | 3.5% |
Area profile
Stable population, middle-aged population.
| Population residents | 9,491 | ▲ +4.6% / 10 yrs |
| Mean age years | 41 | ▼ −3 yrs vs. all of Finland |
| Median income €/yr, residents | 32k | ▲ +21% vs. all of Finland |
| University-educated share of residents | 39% | ▲ +9 pp vs. all of Finland |
| Employment rate of the labour force | 94% | ▲ +6 pp vs. all of Finland |
| Rental homes of households | 8% | ▼ −30 pp vs. all of Finland |
| Average home size m² | 107 | ▲ +36% vs. all of Finland |
Other areas: Kaarina
- 20760 Piispanristi €2,621/m²
- 20780 Kaarina Keskus €2,737/m²
- 21500 Piikkiö €2,719/m²
- 21620 Kuusisto €313,004
Kaarina: prices for all areas and the citywide price trend →
Frequently asked about 20660
What is the price per m² of apartments in postcode area 20660?
In Littoinen (Kaarina), apartments cost an average of €2,749/m² in completed sales over the last 12 months (36 sales, Statistics Finland).
How much does a terraced house cost in 20660?
A typical 85 m² terraced house would cost about €234,000 at the area's realised price per m² (€2,749/m²). The price of an individual apartment differs from this according to its condition, floor, housing company renovations and maintenance charge.
Are apartment prices rising or falling in 20660?
The area's price per m² has risen by about 1.6% a year (sales-weighted trend from quarters Q2/23–Q1/26*).
What is the rental yield in 20660?
The calculated gross rental yield for a Terraced houses is 5.2%: the average rent in Rest of Finland of €11.80/m²/mo relative to this area's price per m² of €2,749/m². After a typical maintenance charge, 3.5%. The figure does not account for empty months, renovations or taxes.
How much does a detached house cost in 20660?
In Littoinen (Kaarina), detached house properties have cost an average of €276,644 in completed sales over the last 3 years (111 sales, National Land Survey of Finland's register of property prices). The figure is the total property price and is not adjusted for house size, so large and small houses share the same average.
Are detached house prices rising or falling in 20660?
The area's average detached house price has risen by about 1.9% a year (sales-weighted trend from 2017–2025). The current year is incomplete and not included in the trend.
What kind of area is 20660 Littoinen?
The area has 9,491 residents (2024), the mean age is 41 and the median income of residents is €31,905 a year. The share of university-educated residents is 39%. The population has grown by 5% in ten years.
Sources and method
- Apartment prices: Statistics Finland, prices of housing company apartments (StatFin 13mt). Updated 17 August 2026. The average price per m² is a sales-weighted average of completed sales over the last four quarters, shown only if there are at least 6 sales.
- Detached house prices: National Land Survey of Finland, register of property prices (detached house properties, built plots). Updated 28 October 2026. The average price is a sales-weighted average of completed sales over the last 3 years, shown only if there are at least 8 sales. The figure is the total property price: the register has no floor area for the building, so no price per m² is calculated.
- Rents: Statistics Finland, rents of housing company apartments (StatFin 15fa, non-subsidised). Quarter 2026Q3. City-level, not postcode-level.
- Population, income and education: Statistics Finland, Paavo: open data by postcode area (12f7). Statistical year 2024.
- Limitations: the figures are area averages. They do not tell you the value of an individual apartment and are not investment advice. In areas with few sales a single sale moves the average.